
Disclaimer: Investing and trading involve risk. The investing strategy or tactic mentioned in this article is for educational purposes only. Use it at your own risk. And think twice.
Intro
The pandemic is sending shocks through the global economy, Coronavirus has decimated air travel, depressing retail trade, the impact is being felt by all businesses around the world. Boeing (NYSE:BA) is one of the canonical stock price change examples of how the market reacts to the virus outbreak.

Bet you can name several industries, economic sectors, or companies with the same price pattern just off the top of your head: hotels, casinos, restaurants, entertainment. Nevertheless, there are about 6k companies that trade on the NYSE and Nasdaq and 11k securities, including mutual funds, ETFs, forwards, futures, etc. Pretty wide variety of options. You won’t manually check them all, Python will.
The idea of this post is to programmatically define underdogs like Boeing that look well-positioned to capitalize on recovery. Let’s take a closer look.
Define the COVID pattern
Firstly, we have to simplify the time series from the example above and describe the form: pre-pandemic state, huge drop in March, and the plateau of uncertainty with a low-volatility price. You might call this pattern a reverse sigmoid curve (f nerds), but let’s name it porebrick instead for simplicity's sake, which stands for curbstone in English.

Find similar positions
Since we understand what pattern we’re looking for, we have to set a benchmark. One way to do this is to randomly select several stocks from different industries most impacted by COVID (airlines, casinos, hotels) and aggregate them into one feature. Thereafter, we need to compare this aggregated time series with each security on the market and measure similarity as a result.
Many ML techniques i.e. Recommender systems, Clusterization, NLP are based on a similarity between vectors or entities. There are several similarity measures and distance metrics, such are:
- Cosine Similarity
- Pearson’s, Spearman’s Correlations
- Jaccard similarity
- Euclidean Distance
- Manhattan Distance
You can find Maths behind these metrics on the Internet, however, these metrics can’t be properly scaled to time series with millions of observations. Also, we are dealing with financial data and designing the strategy for the market with many players, seeing that you should develop a model that uses an algorithm a little bit off the beaten path.
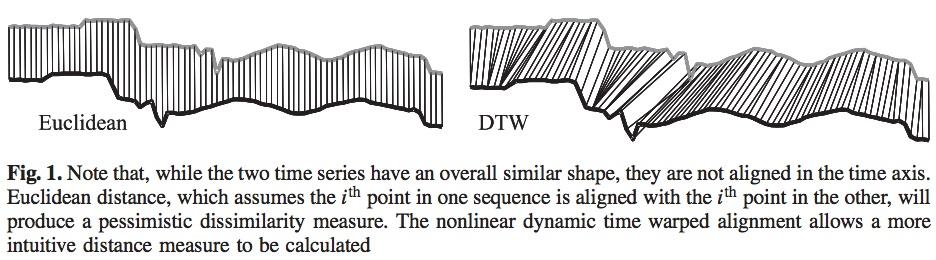
Here comes Dynamic Time Warping. The algorithm from the mid-90s matches similar temporal sequences by taking time shifts into account. It’s actively used in speech recognition, object tracking, and other domains. It finds optimal alignment between a pair of time series even if one has some delay or shift. The original DTW has quadratic complexity, luckily two faster algorithms have been developed recently: FastDTW[1] and UCR-DTM[2]. It's spot-on.
Implementation
Get data
There are many solutions to pull financial data since the financial APIs market actively grows. I’d like to highlight some of them: pandas_datareader, googlefinance, investpy, FMP (250 requests limit).
The code below pulls, normalize, aggregate, and save to data frame stock prices of random companies from industries impacted by COVID – airlines, casinos, hotels.
# benchmark tickers
airlines = ['BA', 'SAVE', 'JBLU']
hotels = ['MGM', 'MAR', 'H']
casinos = ['LVS', 'WYNN']
covid_pattern_benchmark = covid_pattern + hotels + casinos

# pull data
covid_stocks = get_ticket_data(tickets=covid_pattern, data_source=source, start=start, end=end)
covid_stocks['total_mean'] = covid_stocks.mean(axis=1)
covid_stocks_norm = covid_stocks.apply(lambda x: normalize_data(x), axis=0)
Apply Dynamic Time Warping
Fortunately, Dynamic Time Warping has been implemented in Python, the package called fastdtw. The following chunk of code iterates across all stocks on the market and measures similarity with our covid pattern benchmark. As a result, I’ll get the dictionary with ticker and similarity value.
similarity_dic = dict()

for ticker in all_stocks_df.columns:
   covid_pattern_ts = np.array(covid_stocks_norm['total_mean'])
   stock_ts = np.array(all_stocks_df[ticker])

   # measure distance
   distance, path = fastdtw(covid_pattern_ts, stock_ts, dist=euclidean)
   print(ticker, distance)

   # update dic
   similarity_dic[ticker] = distance
Sanity check
Now we have a few hundreds of selected stocks similar to the covid pattern benchmark. Instead of developing a new performance metric, I randomly picked ten tickers and did this plot:
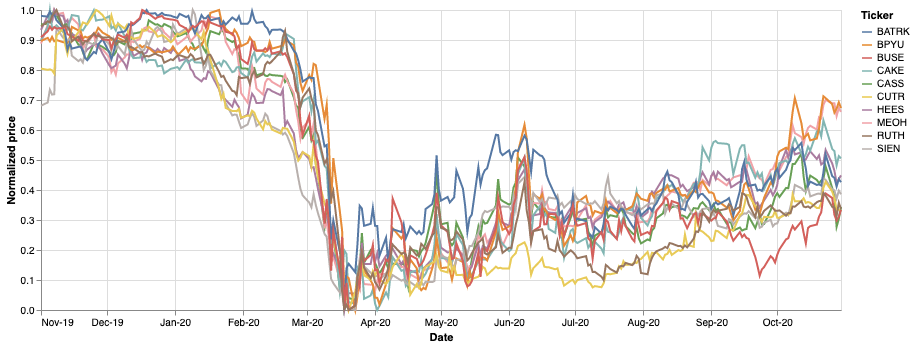
Have you noticed porebrick? I have no doubt. I reviewed selected stocks and found that DTW approach was able to detect the pattern in different sectors as well: amusement parks, movie theatres, cruise lines, commercial real estate, Caribbean hotels group. A pretty good result given that we used only technical analysis.
I’ve uploaded JSON with resulting tickers and distance values (the lower the better).
Rank them out
Empirically proven – all selected companies have the COVID pattern described above. There still are hundreds of options to buy. Make your first cut by removing some industries upon your preference, then you can use regex to filter banks or financial organizations by keywords. Apply a no-trade list if applicable.
The next thing to do is to sort stocks by Volume and dividend yield. This could slightly hedge your investment bets and avoid low-volume stocks (risk of bankruptcy).
Here is an example of calling dividend stats with investpy:
stock_div = []
for ticket in list(watch_list.keys()):
   print(ticket)
   try:
       stock_div.append(
           {
               'ticket': ticket,
               'div': investpy.stocks.get_stock_dividends(stock=ticket)['Dividend'].iloc[0],
               'div_date_update': investpy.stocks.get_stock_dividends(stock=ticket)['Date'].iloc[0],
               'div_type': investpy.stocks.get_stock_dividends(stock=ticket)['Type'].iloc[0],
               'div_yield': investpy.stocks.get_stock_dividends(stock=ticket)['Yield'].iloc[0],
           }
       )
   except:
       stock_div.append({'ticket': ticket})
As a result, you ended up with dozens of stocks that you can roll into your portfolio.
Call to action
Warren Buffett strongly advises investing in index funds and holding for long term. I can not argue with that. After you get the final watchlist of stocks, just find the mutual funds that hold them – an easy way to diversify your portfolio.
You might have noticed that I didn't take November data into account. The idea is to use November growth rate as a risk tolerance features. If you opt for conservative actions, simply filter out all stock with positive growth in November.
Having said all that, investing is risky, and further upside is hard to justify, even under optimistic long-term growth assumptions.

Epilogue
It shouldn't come as a surprise that any strategy you glancing through won’t crack the market. Even though this was an example of Dynamic Time Warping in finance applications, which you can improve, reinforce, or transfer to different domains: Churn Prediction, Customer Lifetime Value (CLV) Prediction, Customers behavior patterns segmentation.
I hope you enjoyed and learned something new. It’s your turn now.
Request jupyter/Colab/Datalore notebook in comments if you need it – trying to engage the audience.
Resources and further reading
- Using Dynamic Time Warping to FindPatterns in Time Series.
- FastDTW: Toward Accurate Dynamic Time Warping in Linear Time and Space.
- UCR-DTW project and journal article.
- Video that gives a nice introduction to DTW.